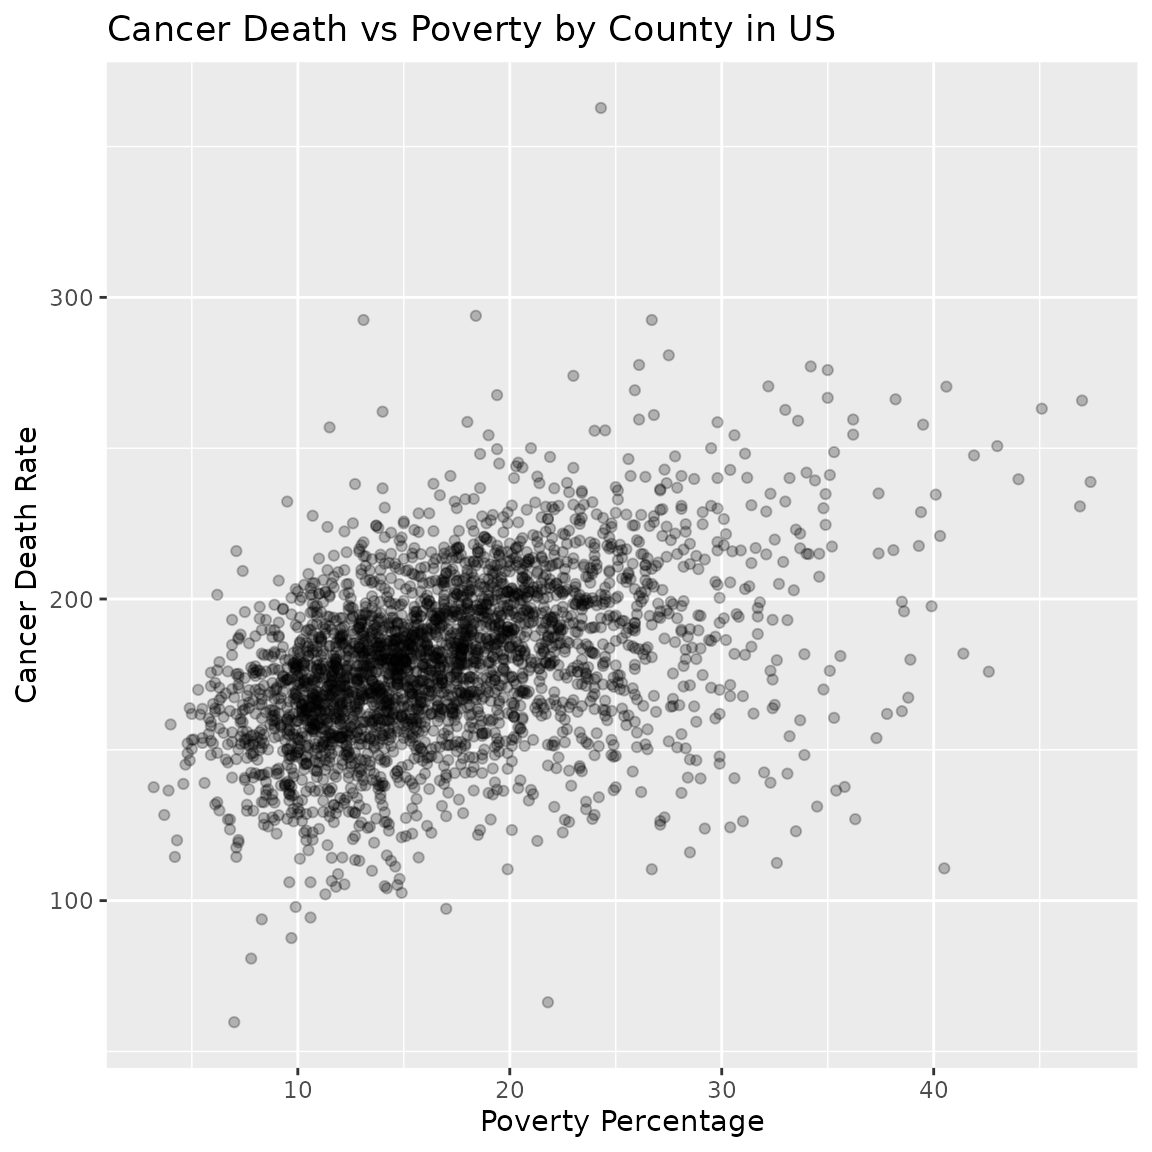
Cancer Death vs Poverty by County in US
cancer_reg.RmdLoad data
Read directly from this URL then rename one column.
Load data:
cancer_reg <- readr::read_csv("https://raw.githubusercontent.com/Arnab777as3uj/STAT6021-Cancer-Prediction-Project/master/cancer_reg.csv")
#> Rows: 3047 Columns: 34
#> ── Column specification ────────────────────────────────────────────────────────
#> Delimiter: ","
#> chr  (2): binnedInc, Geography
#> dbl (32): avgAnnCount, avgDeathsPerYear, TARGET_deathRate, incidenceRate, me...
#>
#> ℹ Use `spec()` to retrieve the full column specification for this data.
#> ℹ Specify the column types or set `show_col_types = FALSE` to quiet this message.
See a summary:
summary(cancer_reg)
#>   avgAnnCount      avgDeathsPerYear TARGET_deathRate incidenceRate
#>  Min.   :    6.0   Min.   :    3    Min.   : 59.7    Min.   : 201.3
#>  1st Qu.:   76.0   1st Qu.:   28    1st Qu.:161.2    1st Qu.: 420.3
#>  Median :  171.0   Median :   61    Median :178.1    Median : 453.5
#>  Mean   :  606.3   Mean   :  186    Mean   :178.7    Mean   : 448.3
#>  3rd Qu.:  518.0   3rd Qu.:  149    3rd Qu.:195.2    3rd Qu.: 480.9
#>  Max.   :38150.0   Max.   :14010    Max.   :362.8    Max.   :1206.9
#>
#>    medIncome        popEst2015       povertyPercent   studyPerCap
#>  Min.   : 22640   Min.   :     827   Min.   : 3.20   Min.   :   0.00
#>  1st Qu.: 38882   1st Qu.:   11684   1st Qu.:12.15   1st Qu.:   0.00
#>  Median : 45207   Median :   26643   Median :15.90   Median :   0.00
#>  Mean   : 47063   Mean   :  102637   Mean   :16.88   Mean   : 155.40
#>  3rd Qu.: 52492   3rd Qu.:   68671   3rd Qu.:20.40   3rd Qu.:  83.65
#>  Max.   :125635   Max.   :10170292   Max.   :47.40   Max.   :9762.31
#>
#>   binnedInc           MedianAge      MedianAgeMale   MedianAgeFemale
#>  Length:3047        Min.   : 22.30   Min.   :22.40   Min.   :22.30
#>  Class :character   1st Qu.: 37.70   1st Qu.:36.35   1st Qu.:39.10
#>  Mode  :character   Median : 41.00   Median :39.60   Median :42.40
#>                     Mean   : 45.27   Mean   :39.57   Mean   :42.15
#>                     3rd Qu.: 44.00   3rd Qu.:42.50   3rd Qu.:45.30
#>                     Max.   :624.00   Max.   :64.70   Max.   :65.70
#>
#>   Geography         AvgHouseholdSize PercentMarried   PctNoHS18_24
#>  Length:3047        Min.   :0.0221   Min.   :23.10   Min.   : 0.00
#>  Class :character   1st Qu.:2.3700   1st Qu.:47.75   1st Qu.:12.80
#>  Mode  :character   Median :2.5000   Median :52.40   Median :17.10
#>                     Mean   :2.4797   Mean   :51.77   Mean   :18.22
#>                     3rd Qu.:2.6300   3rd Qu.:56.40   3rd Qu.:22.70
#>                     Max.   :3.9700   Max.   :72.50   Max.   :64.10
#>
#>    PctHS18_24   PctSomeCol18_24 PctBachDeg18_24   PctHS25_Over
#>  Min.   : 0.0   Min.   : 7.10   Min.   : 0.000   Min.   : 7.50
#>  1st Qu.:29.2   1st Qu.:34.00   1st Qu.: 3.100   1st Qu.:30.40
#>  Median :34.7   Median :40.40   Median : 5.400   Median :35.30
#>  Mean   :35.0   Mean   :40.98   Mean   : 6.158   Mean   :34.80
#>  3rd Qu.:40.7   3rd Qu.:46.40   3rd Qu.: 8.200   3rd Qu.:39.65
#>  Max.   :72.5   Max.   :79.00   Max.   :51.800   Max.   :54.80
#>                 NA's   :2285
#>  PctBachDeg25_Over PctEmployed16_Over PctUnemployed16_Over PctPrivateCoverage
#>  Min.   : 2.50     Min.   :17.60      Min.   : 0.400       Min.   :22.30
#>  1st Qu.: 9.40     1st Qu.:48.60      1st Qu.: 5.500       1st Qu.:57.20
#>  Median :12.30     Median :54.50      Median : 7.600       Median :65.10
#>  Mean   :13.28     Mean   :54.15      Mean   : 7.852       Mean   :64.35
#>  3rd Qu.:16.10     3rd Qu.:60.30      3rd Qu.: 9.700       3rd Qu.:72.10
#>  Max.   :42.20     Max.   :80.10      Max.   :29.400       Max.   :92.30
#>                    NA's   :152
#>  PctPrivateCoverageAlone PctEmpPrivCoverage PctPublicCoverage
#>  Min.   :15.70           Min.   :13.5       Min.   :11.20
#>  1st Qu.:41.00           1st Qu.:34.5       1st Qu.:30.90
#>  Median :48.70           Median :41.1       Median :36.30
#>  Mean   :48.45           Mean   :41.2       Mean   :36.25
#>  3rd Qu.:55.60           3rd Qu.:47.7       3rd Qu.:41.55
#>  Max.   :78.90           Max.   :70.7       Max.   :65.10
#>  NA's   :609
#>  PctPublicCoverageAlone    PctWhite         PctBlack          PctAsian
#>  Min.   : 2.60          Min.   : 10.20   Min.   : 0.0000   Min.   : 0.0000
#>  1st Qu.:14.85          1st Qu.: 77.30   1st Qu.: 0.6207   1st Qu.: 0.2542
#>  Median :18.80          Median : 90.06   Median : 2.2476   Median : 0.5498
#>  Mean   :19.24          Mean   : 83.65   Mean   : 9.1080   Mean   : 1.2540
#>  3rd Qu.:23.10          3rd Qu.: 95.45   3rd Qu.:10.5097   3rd Qu.: 1.2210
#>  Max.   :46.60          Max.   :100.00   Max.   :85.9478   Max.   :42.6194
#>
#>   PctOtherRace     PctMarriedHouseholds   BirthRate
#>  Min.   : 0.0000   Min.   :22.99        Min.   : 0.000
#>  1st Qu.: 0.2952   1st Qu.:47.76        1st Qu.: 4.521
#>  Median : 0.8262   Median :51.67        Median : 5.381
#>  Mean   : 1.9835   Mean   :51.24        Mean   : 5.640
#>  3rd Qu.: 2.1780   3rd Qu.:55.40        3rd Qu.: 6.494
#>  Max.   :41.9303   Max.   :78.08        Max.   :21.326
#>
Rename the “TARGET_deathRate” column to “cancer_death_rate”:
cancer_reg <- dplyr::rename(cancer_reg, "cancer_death_rate" = "TARGET_deathRate")Make scatter plot, giving points alpha=25% opacity:
ggplot(cancer_reg, aes(x = povertyPercent, y = cancer_death_rate)) +
  geom_point(alpha = 0.25) +
  xlab("Poverty Percentage") +
  ylab("Cancer Death Rate") +
  ggtitle("Cancer Death vs Poverty by County in US")